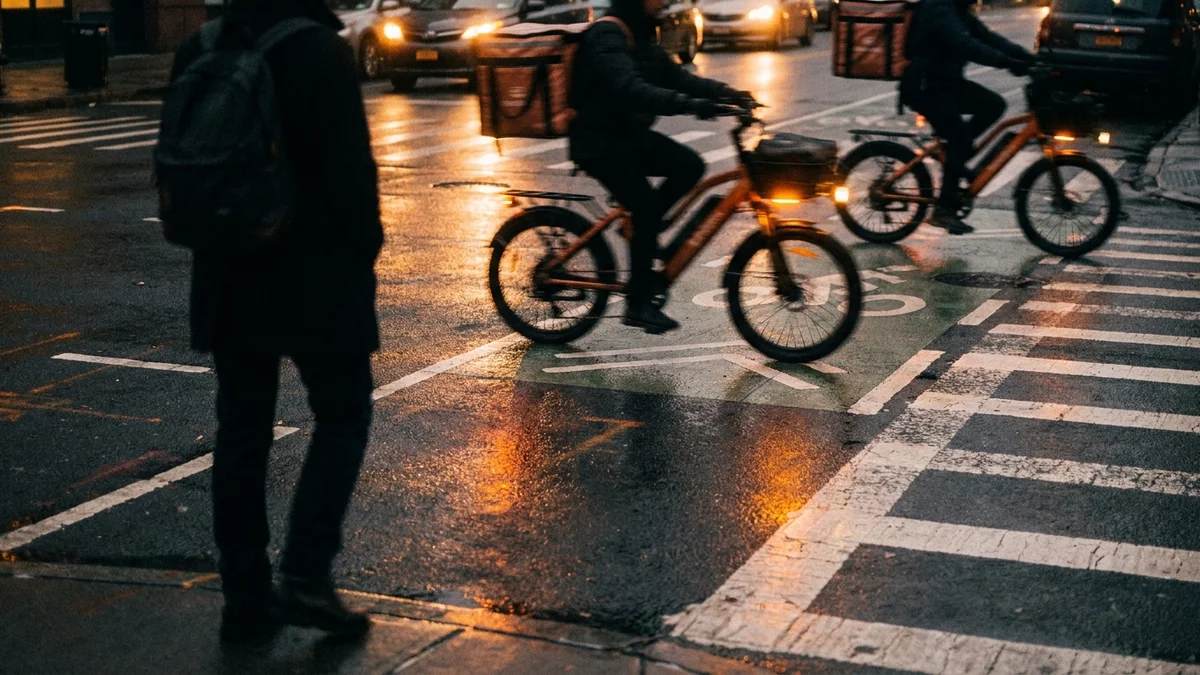
On January 5, 2025, New York City activated congestion pricing in Manhattan south of 60th Street. One year later, the safety data is in.
Traffic fatalities in the toll zone dropped 40%. Crashes fell 7%. Injuries fell 8%. Not a single motorist, passenger, moped rider, or motorcyclist died in a crash in the Congestion Relief Zone during the first six months.
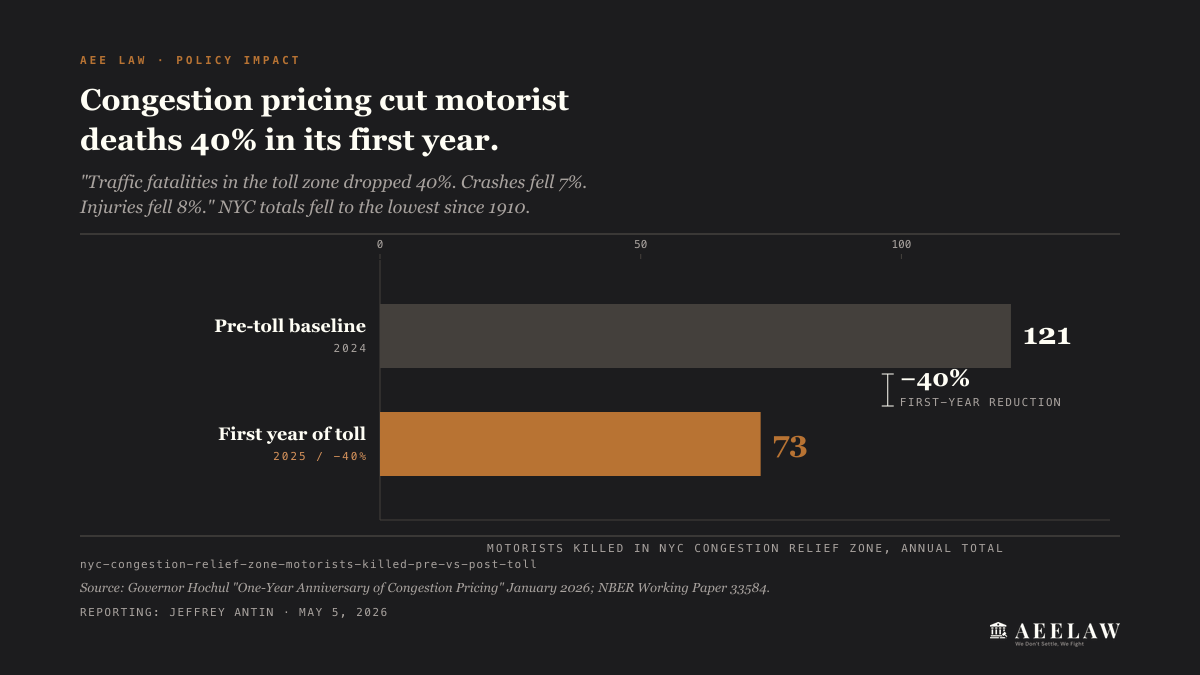
Citywide, NYC recorded 205 traffic deaths in 2025. That is the fewest since the city started keeping records in 1910.
One Year of Data
The $9 peak toll pushed 27 million vehicles out of the zone over 12 months, roughly 73,000 fewer cars per day. That 11% traffic reduction translated directly into fewer crashes and fewer people killed or seriously injured. Governor Hochul’s one-year anniversary announcement reports the first-year safety results. An NBER working paper (No. 33584) on the program’s short-run economic effects documents the traffic-volume drop that drives them.
| Metric | Before | After | Change |
|---|---|---|---|
| Vehicles entering zone (daily avg) | ~730,000 | ~657,000 | -11% |
| Crashes in CRZ (full year) | 6,191 | 5,742 | -7.3% |
| Injuries in CRZ (full year) | 2,929 | 2,691 | -8.1% |
| Fatalities in CRZ | Baseline | Down 40% | -40% |
| Citywide traffic deaths | 253 (2024) | 205 (2025) | -19% |
Early months showed even stronger results. In the first four months, crashes in the zone fell 13%. At the six-month mark, crashes were down 14% and injuries down 15%. The effect moderated slightly over the full year as some drivers adjusted their behavior, but the safety gains held.
Record Low Traffic Deaths
The 205 total traffic deaths in 2025 broke the previous record of 206 set in 2018. Traffic fatalities are now 31% below 2014 levels, when Vision Zero launched.
| Category | 2024 | 2025 | Change |
|---|---|---|---|
| Pedestrians killed | 122 | 111 | -9% |
| Motorists killed | 121 | 73 | -40% |
| Cyclists killed (incl. e-bikes) | 23 | 21 | -9% |
| Children killed | 16 | 6 | -63% |
By borough:
| Borough | 2024 | 2025 | Change |
|---|---|---|---|
| Queens | 74 | 57 | -23% |
| Brooklyn | 69 | 63 | -9% |
| Bronx | 54 | 33 | -39% |
| Manhattan | 44 | 39 | -11% |
| Staten Island | 12 | 13 | +8% |
The Bronx saw the largest percentage decline: 39% fewer traffic deaths. The Cross Bronx Expressway remains the most congested highway in the country, but the surrounding streets are getting safer.
Queens, which had the highest raw fatality count in 2024, dropped 23%. The redesign of Queens Boulevard continues to show results. That corridor has seen 68% fewer fatalities and 45% fewer pedestrian injuries since its transformation.
Air Quality Improvements
A Cornell University study published in npj Clean Air in December 2025 measured the air quality impact using data from 42 monitors across 518 days.
PM2.5 pollution in the congestion zone dropped 22% in the first six months. The average daily maximum fell by 3.05 micrograms per cubic meter, from a projected 13.8 without pricing to an observed 10.75.
The benefits extended beyond the toll zone. The five-borough average PM2.5 fell by 1.07 micrograms per cubic meter. Even the broader metro area saw reductions of 0.70 micrograms per cubic meter.
For the Bronx, where children living near the Cross Bronx Expressway are four times more likely to visit the ER for asthma, these numbers have direct health implications.
What It Costs, Where It Goes
Governor Hochul cut the toll 40% before launch, so the $9 peak rate runs at 60% of the originally approved amount.
| Vehicle type | Peak toll | Off-peak toll |
|---|---|---|
| Passenger car (E-ZPass) | $9 | $2.25 |
| Small truck | $14.40 | $3.60 |
| Large truck | $21.60 | $5.40 |
| Taxi surcharge | $0.75/trip | $0.75/trip |
| Uber/Lyft surcharge | $1.50/trip | $1.50/trip |
Revenue in the first year: approximately $550 million, about $50 million more than projected. That money backs $15 billion in MTA bonds for the 2020 to 2024 Capital Plan.
Projects now in construction include Second Avenue Subway Phase 2, ADA accessibility upgrades at nine stations, new signal systems for the A/C lines serving 600,000 riders in Brooklyn and Queens, and new Staten Island Railway cars.
Speed and Transit Gains
Less traffic means faster movement for everyone still on the road.
Speeds on Manhattan river crossings increased 23%. At the six-month mark, the Holland Tunnel saw rush hour delays drop 65%. Lincoln Tunnel express buses run 24% faster than in 2024.
MTA bus speeds within the congestion zone increased 2.3%, reversing a declining trend from prior years. Subway and bus ridership citywide rose 7%. Long Island Rail Road ridership increased 9%.
Noise complaints to 311 dropped 45% through the first six months.
The Legal Challenge
The program survived a legal challenge from the federal government. In March 2026, Federal Judge Lewis Liman ruled that the U.S. Department of Transportation lacked the authority to unilaterally rescind its approval of congestion pricing. The ruling found the agency’s reversal arbitrary and capricious and not in accordance with law.
The Trump administration said it would “explore other avenues.” For now, the program continues.
What This Means for Injury Cases
Fewer crashes means fewer people walking into our office with catastrophic injuries. That is a good outcome.
But 205 people still died on NYC streets in 2025. Pedestrians still account for more than half of all traffic deaths. Brooklyn and Queens still lead in raw crash volume. The corridors that generate the most serious injury cases, Atlantic Avenue, Northern Boulevard, the Belt Parkway, remain dangerous.
When crashes do happen in the congestion zone, the dynamics have shifted. Lower traffic volumes make it harder for at-fault drivers to blame congestion or “unavoidable” conditions. Speed data is more granular. Camera coverage is more comprehensive.
For pedestrians, cyclists, and drivers injured in the zone, the same legal principles apply. New York applies comparative negligence under CPLR § 1411. For motor vehicle lawsuits filed on or after May 26, 2026, CPLR § 1411(b), added by Bill A10008 (Chapter 58 of 2026), bars recovery when the injured person’s fault is greater than the combined fault of the defendants. Drivers owe a duty of care regardless of toll payments. And the 90-day Notice of Claim deadline under General Municipal Law § 50-e for injuries involving city vehicles or infrastructure has not changed. The NYC Open Data Motor Vehicle Collisions dataset now captures post-congestion-pricing crash patterns that can document the zone’s improved safety record.
The congestion pricing data tells a clear story: fewer vehicles means fewer deaths. The question is whether the gains survive the political and legal challenges ahead.