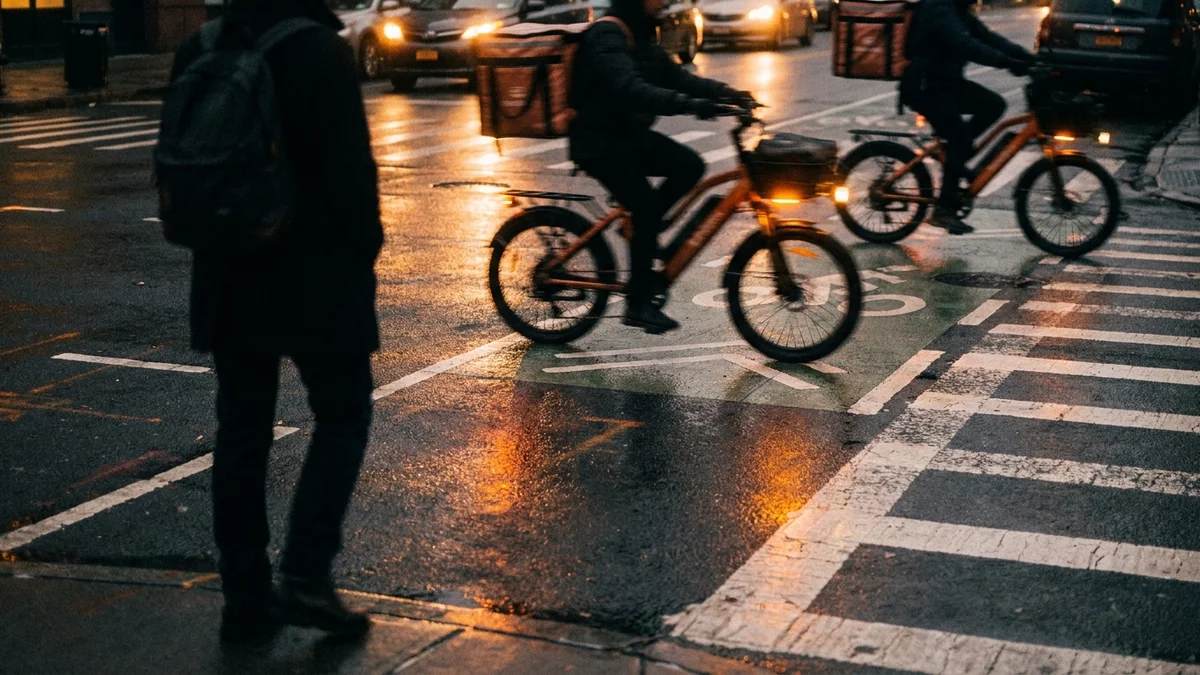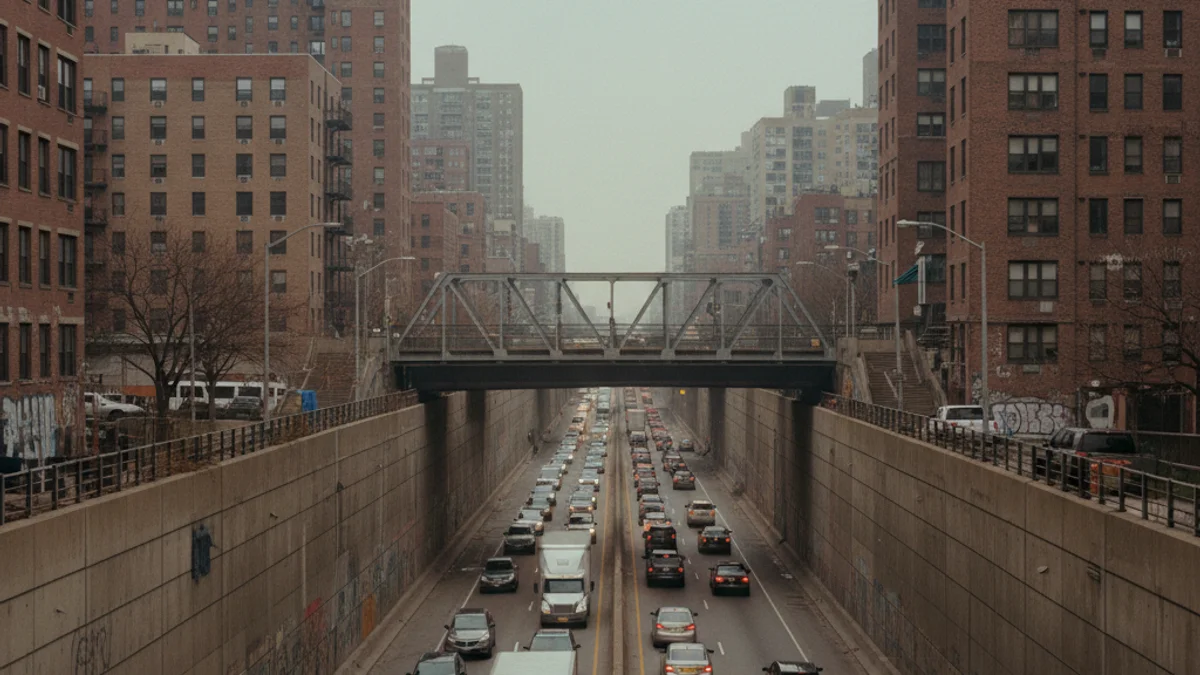
The Cross Bronx Expressway carries roughly 165,000 vehicles per day through a 4.7-mile trench cut through the heart of the Bronx. One in five is a freight truck. The road has no shoulders on most sections. INRIX named it the most congested road in the United States for four consecutive years.
This isn’t a highway with a safety problem. It’s a highway that is the problem.
The Traffic Numbers
MTA court filings from 2024 put the daily volume at approximately 146,700 cars and 18,000 trucks. NYC DOT’s Reimagine the Cross Bronx study confirmed one in five vehicles is a freight vehicle, with an average of 300 diesel trucks passing through per hour.
The INRIX Global Traffic Scorecard found drivers on the Cross Bronx waste an average of 86 hours per year sitting in congestion. That’s more than 3.5 full days. In 2008, Cross Bronx interchanges held 3 of the top 4 spots on the national worst interchange list.
After congestion pricing launched in January 2025, car traffic declined 2.5% and truck traffic dropped 1.2%. Cars fell from 146,711 to 143,043 per day. Trucks from 18,034 to 17,811.
Crash Data
Finding comprehensive annual crash totals specifically for the Cross Bronx is difficult. NYPD and NYC DOT track collisions by intersection, not by expressway segment. The available data points to consistent danger.
The Macombs Road overpass area recorded 13 crashes, 24 injuries, and 1 death in 2021 alone. The Bronx River Parkway on-ramp from the Cross Bronx matched those numbers: 13 accidents, 24 injuries, 1 fatality in the same year.
NYC DOT’s Reimagine study found 5 Vision Zero Priority Intersections and 13 Vision Zero Priority Corridors within the Cross Bronx study area.
Fatal truck crashes on the expressway are a recurring pattern. A woman killed in a crash with two semi-trucks. A driver died in a collision with a tractor-trailer near Jerome Avenue in February 2024. Three people killed in a single semi-truck crash in 2017. The expressway’s narrow lanes and tight curves make it particularly dangerous for commercial vehicles that need more space to maneuver.
The Bronx in Context
The Bronx recorded 54 traffic deaths in 2024, dropping to 33 in 2025 (a 39% decline, the sharpest improvement of any borough).
| Borough | 2024 Deaths | 2025 Deaths | Change |
|---|---|---|---|
| Bronx | 54 | 33 | -39% |
| Brooklyn | 69 | 63 | -9% |
| Queens | 74 | 57 | -23% |
| Manhattan | 44 | 39 | -11% |
| Staten Island | 12 | 13 | +8% |
But the fatality decline masks a serious injury problem. The Bronx’s serious injury rate per capita is 20% higher than the citywide average. In 2024, serious injuries from traffic crashes in the Bronx rose 10% compared to the prior year.
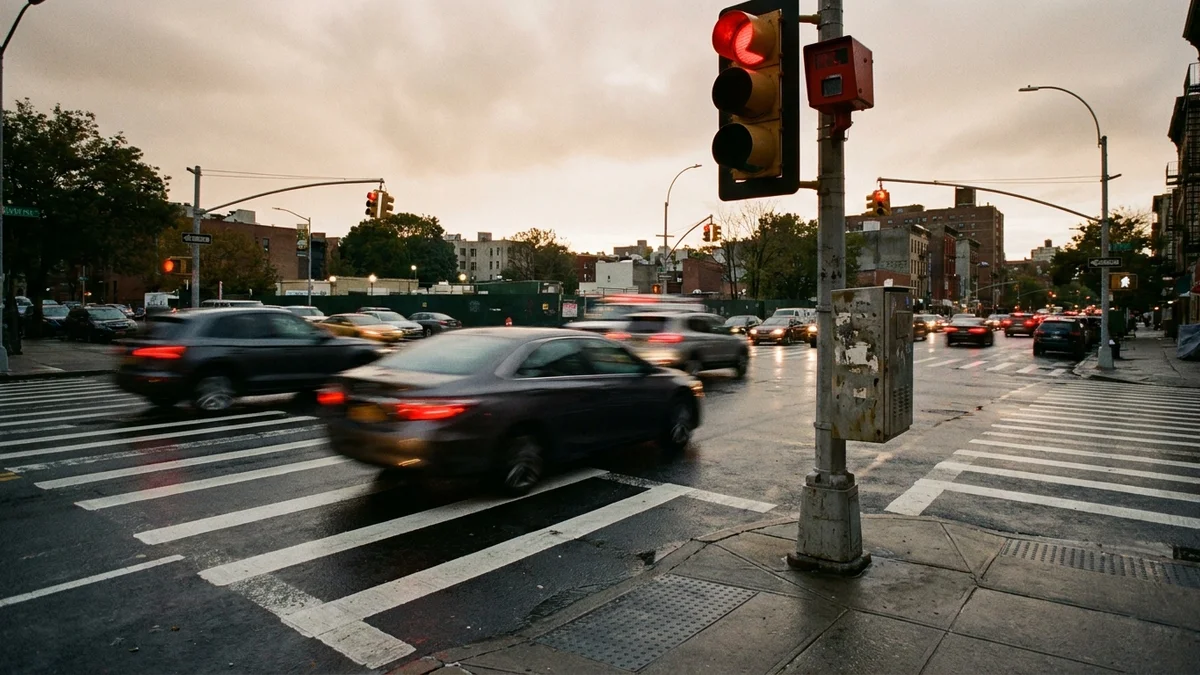
Distracted driving was the single leading cause of Bronx crashes. The full breakdown from 2021 NYPD data shows the pattern:
- Distracted driving: 2,660 crashes
- Passing violations: 1,010
- Failure to yield: 679
- Unsafe speed: 590
- Tailgating: 403
- Running red lights: 374
- Intoxication: 233
Other Dangerous Bronx Roads
The Cross Bronx isn’t the only dangerous corridor.
Bruckner Boulevard and St. Ann’s Avenue is the most dangerous intersection in the Bronx according to Transportation Alternatives. Eight people killed or seriously injured there in 5 crashes: 5 motorists and 3 pedestrians.
East 138th Street is the deadliest roadway in New York City for its length. Twelve people died on a stretch of just over 1.5 miles between 2014 and 2023, close to 8 fatalities per mile. For comparison, Woodhaven Boulevard in Queens had 18 total deaths but only 4.4 per mile.
The Grand Concourse, the Bronx’s own “Boulevard of Death,” saw 12 pedestrians killed and 43 seriously injured between 2009 and 2013. The road is 180 feet wide and 4.5 miles long. Its width encourages speeding. It forces pedestrians into long, exposed crossings. Grand Concourse and East 170th Street recorded 2 pedestrian fatalities at a single intersection in one year.
Fordham Road, from the University Heights Bridge to the Bronx River Parkway, produced 38 serious pedestrian injuries and 2 fatalities along its 2.3-mile length.
The Racial Disparity
Traffic safety improvements haven’t reached all communities equally. Transportation Alternatives data covering 2014 through 2023 found:
- Majority-white community boards: 4% decrease in traffic deaths
- Majority-Black community boards: 13% increase
- Majority-Latino community boards: 30% increase
The Bronx, where Black and Latino residents make up the vast majority of the population, has seen the consequences of this disparity.
Only 6% of NYC’s protected bike lanes are in the Bronx, despite every borough having approximately the same rate of bike ridership. Nearly 100% of cyclist deaths citywide occurred on streets without protected bike lanes.
The Health Toll Beyond Crashes
The Cross Bronx doesn’t just kill people in crashes. It kills them slowly through the air they breathe.
NYC DOT’s Reimagine study documented the health impact on the 220,000 New Yorkers who live near the highway. Most are Black and Latino:
- Approximately 25 premature deaths per year from traffic-related fine particulates
- Roughly 100 emergency department visits for asthma per year in surrounding neighborhoods
- Diabetes rates exceed citywide rates by up to 100%
- Hypertension rates exceed citywide rates by up to 50%
- Children in the Cross Bronx study area are 4 times more likely to visit the ER for asthma than children citywide
The South Bronx is known as “Asthma Alley.” The Bronx has the highest asthma rate in New York State and among the highest in the country. Columbia University’s Mailman School of Public Health estimated capping sections of the expressway could cut asthma rates in adjacent neighborhoods in half.
Robert Moses and the Road That Destroyed a Borough
The Cross Bronx was the first highway built through a crowded urban environment in the United States. Robert Moses pushed the project through between 1948 and 1963. At its peak, it was the most expensive mile of road ever built: $40 million per mile, roughly $480 million today.
The construction displaced an estimated 40,000 residents and destroyed the East Tremont neighborhood. Robert Caro’s “The Power Broker” argues Moses intentionally routed the highway through East Tremont even though a more viable path existed one block south. Displaced residents received inadequate compensation and relocation assistance.
Property values collapsed. White residents left for the suburbs, aided by government-backed mortgages systematically denied to Black and Brown families through redlining. The communities that remained bore the environmental and health consequences for the next seven decades.
What This Means for Injured Bronx Residents
Crashes on the Cross Bronx and other Bronx corridors frequently involve commercial trucks. That means larger insurance policies and more complex liability questions. Federal trucking regulations including 49 CFR Part 395 require drivers to maintain logbooks and adhere to hours-of-service limits, and 49 CFR Part 396 governs vehicle inspection and maintenance records. Violations can establish negligence.
When dangerous road conditions contribute to a crash, the government entity responsible for maintenance may share liability. The Cross Bronx’s lack of shoulders, poor lighting, and outdated design are documented in the NYC DOT Reimagine the Cross Bronx reports. That documentation can support claims against the city or state.
We’ve handled Bronx car accident and truck accident cases for over 37 years. We know the Cross Bronx. We know Bronx County courts. We know how to build cases that account for the full scope of injuries, including long-term consequences that don’t show up immediately.
Call 212-221-5999 or request a free case review.