New York City recorded 42 traffic fatalities in the first quarter of 2026. That is the third-lowest Q1 total since the city began tracking road deaths in 1910.
Only 2015 and 2018 had fewer deaths at this point in the year.
Pedestrian fatalities fell 21%, from 29 in Q1 2025 to 23 in Q1 2026. Motor vehicle occupant deaths fell 20%, from 10 to 8. Overall traffic fatalities are down 7% year over year.
This is what the Mamdani administration and NYC DOT announced in April 2026. The numbers tell part of the story. The infrastructure decisions behind them tell the rest.
What the Q1 Data Shows
| Metric | Q1 2025 | Q1 2026 | Change |
|---|---|---|---|
| Total traffic deaths | 45 | 42 | -7% |
| Pedestrian deaths | 29 | 23 | -21% |
| Motor vehicle occupant deaths | 10 | 8 | -20% |
| Rank since 1910 records | - | 3rd lowest Q1 | - |
The Q1 2026 total follows a 2025 year that ended with 205 total traffic deaths, the fewest ever recorded in New York City history, per NYC DOT’s January 2026 year-end release. The 2025 number was itself a 19% decline from 253 deaths in 2024.
Two consecutive record-low years in a city of 8.3 million people is not a statistical fluke.
The Policy Drivers
NYC DOT Commissioner Mike Flynn attributes the progress to “targeted, data-informed street redesigns and targeted enforcement against speeding, red-light running, and other dangerous driving behaviors.”
Three policies are doing most of the work.
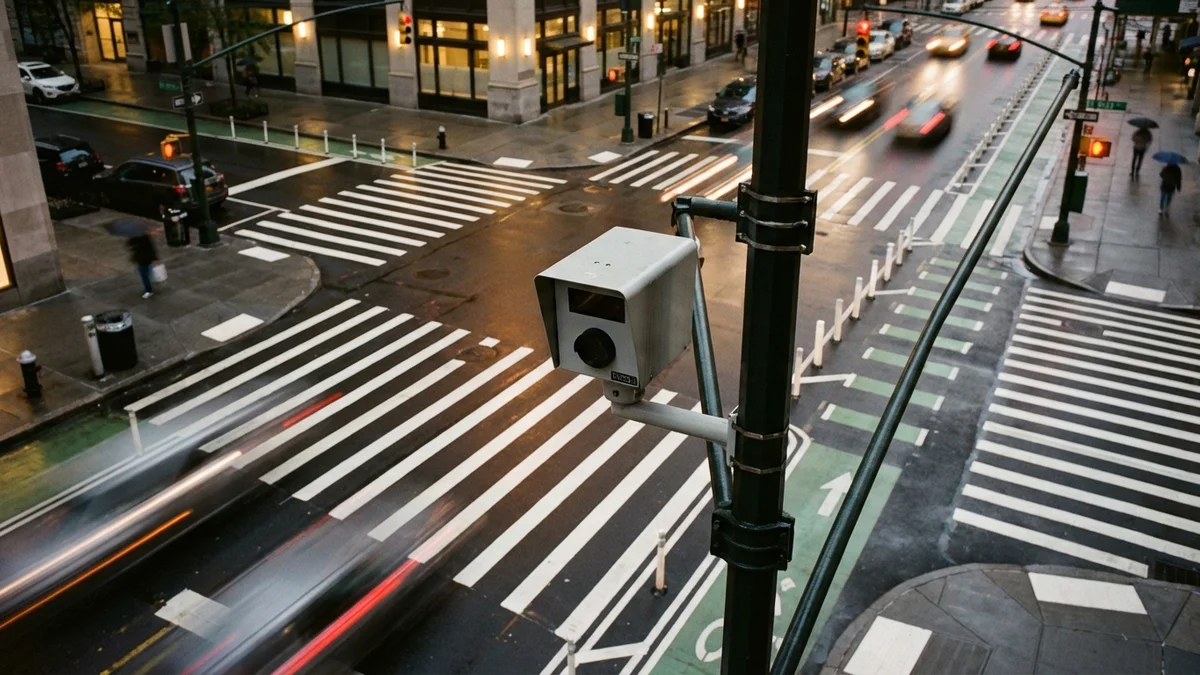
Speed cameras. NYC operates the largest speed camera network in the country. The cameras run 24 hours a day, 7 days a week, and issue $50 tickets for speeding more than 10 mph over the posted limit. DOT data shows they reduce deadly speeding by over 95% at camera locations. Severe traffic injuries fall 14% at installation sites compared to control locations. The state legislature reauthorized the program through 2030.
Protected bike lanes. Physical separation between cyclists and vehicle traffic narrows vehicle lanes, which slows drivers, which reduces the kinetic energy in any crash that does occur. New 2026 projects include McGuinness Boulevard in Greenpoint, Ashland Place in Fort Greene, and Flatbush Avenue. All three corridors had documented histories of pedestrian and cyclist fatalities.
Congestion pricing. Manhattan’s toll zone, active since January 5, 2025, cut traffic fatalities 40% inside the zone in its first year. Crashes fell 7% in the zone. Injuries fell 8%. The reduction in vehicle volume translated directly into fewer collisions.
The Brooklyn Bridge entrance redesign in Lower Manhattan, the Madison Avenue bus lane, and the Fordham Road bus lane in the Bronx add to the citywide picture. Bus lanes reduce conflicts between private cars, buses, and cyclists at the same time they speed up transit.
What the Numbers Do Not Show
The Q1 2026 press release emphasizes the categories that improved. It does not break out cyclist fatalities.
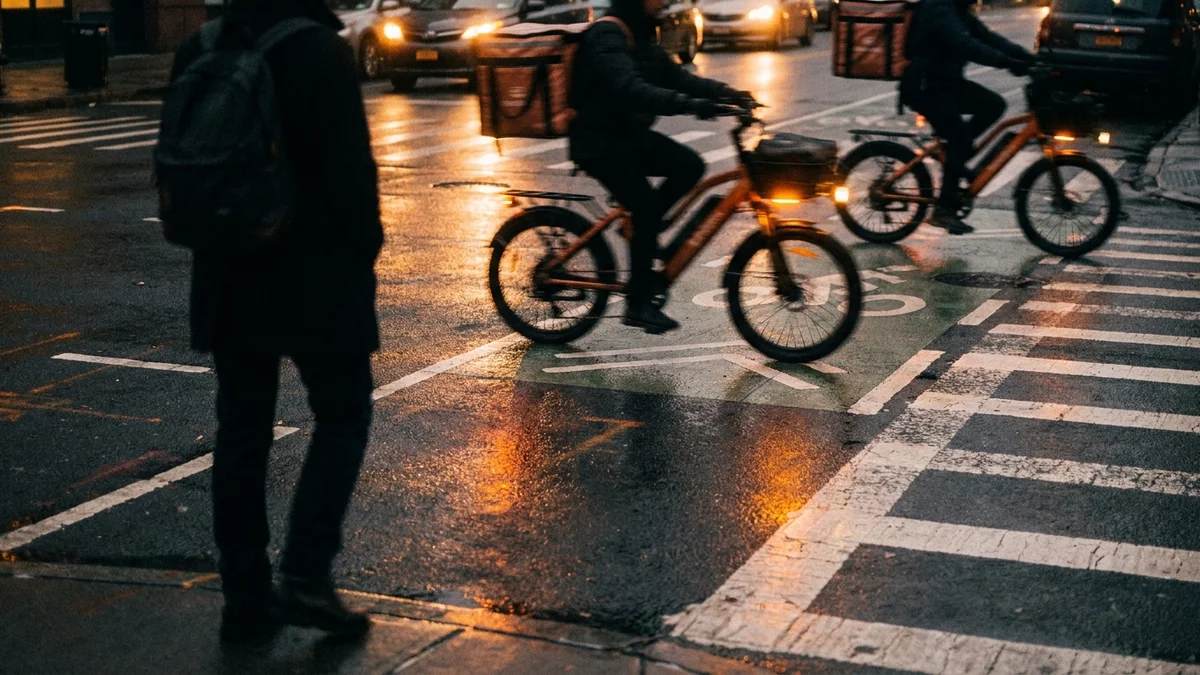
Between 2020 and 2024, e-bikes were reportedly responsible for roughly 1,218 injuries and 13 deaths in NYC. E-bike collisions rose 11% from 2024 to 2025. The injury count among vulnerable road users, which includes pedestrians and cyclists struck by e-bikes and mopeds, has not followed the fatality curve down at the same rate.
Reported moped deaths roughly doubled year over year in mid-2025. Motorized two-wheeler fatalities, which include e-bikes, motorcycles, and mopeds, totaled around 51 through September 2025.
The pattern: fewer people killed by cars, more people injured by motorized micromobility.
The 1910 Context
NYC began systematically recording traffic deaths in 1910, when horse-drawn vehicles still shared the streets with early automobiles. The number rose sharply through the 1920s as cars replaced horses and peaked around 1929 at over 1,300 annual deaths, then stayed elevated for much of the mid-20th century.
The decline from peak to the modern era took nearly 100 years. It tracks with specific interventions: divided highways, signalized intersections, seatbelt laws, drunk driving enforcement, pedestrian signals, and most recently, Vision Zero.
Vision Zero launched in NYC in 2014 under the de Blasio administration. The program set a goal of eliminating traffic deaths by 2024. That target was not met. But the decade since launch has produced the lowest fatality numbers in the city’s recorded history.
Why the Decline Matters for Injury Cases
From a personal injury perspective, lower fatality numbers do not mean lower injury numbers. Serious injuries, which include traumatic brain injuries, spinal cord injuries, fractures, and amputations, track closer to crash volume than to death tolls.
NYC crash data shows over 40,000 injury-producing collisions per year even in record-low fatality years. The Motor Vehicle Collisions dataset maintained by NYC Open Data logs every reportable crash in the five boroughs.
The legal framework that governs recovery after a crash has not changed with the Vision Zero numbers. New York remains a no-fault state. Medical bills and lost wages up to $50,000 are covered by the injured person’s own auto insurance, regardless of fault. Pain and suffering recovery requires meeting the “serious injury” threshold in Insurance Law § 5102(d).
When a pedestrian is struck and killed, the family can file a wrongful death claim under EPTL § 5-4.1 within two years. Under current New York law, wrongful death damages are limited to economic losses, which means lost future earnings and funeral costs. The Grieving Families Act, if enacted, would allow families to recover for grief, mental anguish, and loss of companionship. The legislature has passed versions of the bill multiple times. Governor Hochul has vetoed each one.
What the Mamdani Administration Has to Prove
Mayor Zohran Mamdani took office January 1, 2026. The Q1 2026 numbers are the first traffic safety data under his administration, and the trajectory continues the decline that predates him.
The pressure now runs in two directions. Transportation Alternatives and Families for Safe Streets, the advocacy coalitions that have pushed Vision Zero hardest, are asking the administration to accelerate the street redesigns promised in the Vital City road safety blueprint published before the election. That document calls for daylighting at every intersection (removing parking within 20 feet of corners to improve sight lines), expanded bus lanes, and a bike lane on every avenue in Manhattan.
The competing pressure comes from drivers, delivery companies, and outer-borough businesses who have pushed back on every major street redesign in the city’s history. The McGuinness Boulevard project was delayed and partially reversed under the prior administration after local business opposition.
What the Q1 numbers do for the Mamdani administration is provide political cover to continue. The fatality curve is moving the right direction. The speed camera program is producing measurable results. The bike lane network is expanding. The question is whether the administration will push harder on the next tier of interventions, including daylighting, lower default speed limits, and dedicated enforcement in the neighborhoods with the highest crash densities.
Every year the decline continues, the political case for Vision Zero gets stronger. Every year a pedestrian is killed at an intersection the city already knew was dangerous, the case for accountability gets stronger.
What This Means If You’re Hit
Low fatality numbers do not mean the roads are safe. NYC still averages more than 100 pedestrian deaths per year. Cyclists, e-bike riders, and moped operators continue to face rising injury rates. Drivers and passengers still die in 30 to 40 crashes in the first quarter of every year.
If you or a family member is injured in a traffic crash in New York City, the legal deadlines are short. A no-fault application must be filed within 30 days of the collision. A Notice of Claim against the MTA, the city, or any government entity must be filed within 90 days under General Municipal Law § 50-e. A wrongful death claim must be filed within two years under EPTL § 5-4.1.
Missing any of those deadlines can end a case before the facts are ever examined.