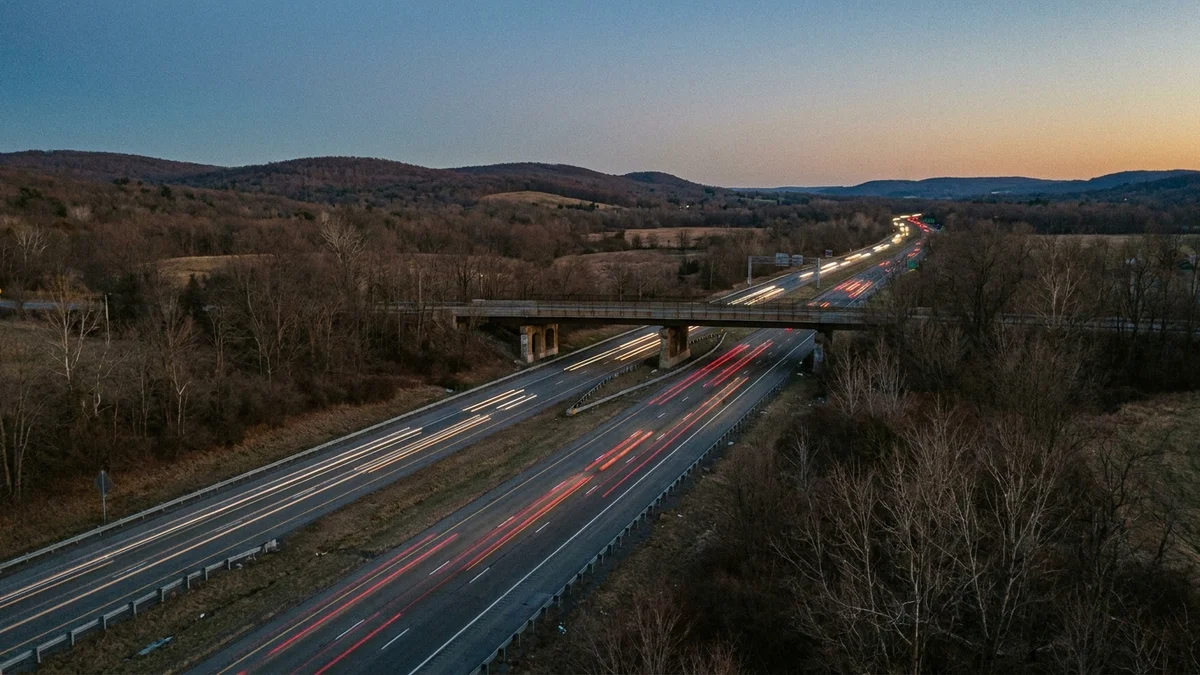
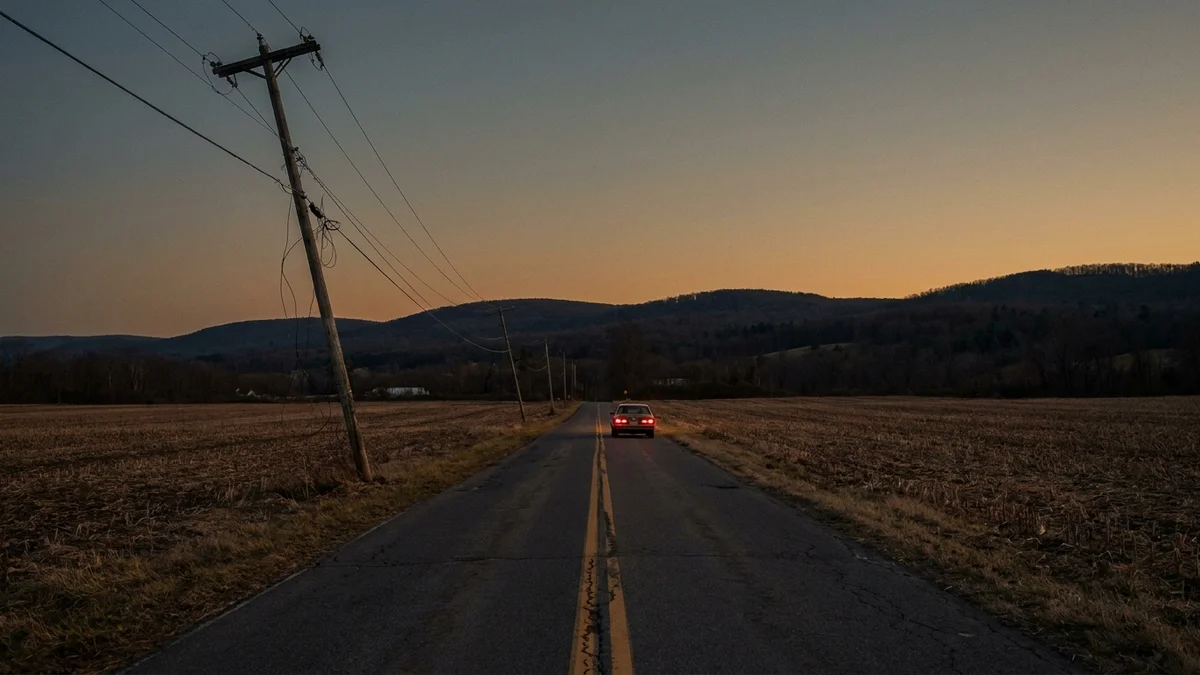
Genesee County sits an hour east of Buffalo, and over the last five years its roads killed people at 7.6 times the rate of Manhattan’s.
Ask most people where New York’s dangerous roads are and they’ll point at the city. The raw crash counts back them up. But the raw counts leave out the part that matters most: how many people live there. Adjust for that, and the map flips. The deadliest roads in New York State are rural.
We counted every traffic death in every New York county over the five years from 2019 through 2023, then divided by how many people live there.
The counties that come out on top aren’t the ones with the most crashes. They’re the ones where a fatal crash is most likely to reach the people who live nearby.
Methodology
We pulled every traffic death in New York State from the federal Fatality Analysis Reporting System, the national census of every crash that kills someone on a public road, for the five years 2019 through 2023.
We grouped the deaths by county and divided each county’s total by its 2021 Census population, the midpoint of the window, to get a rate per 100,000 residents.
To keep a handful of crashes from manufacturing a rate, we ranked only counties with at least 40 deaths over the five years. Every rate below is cumulative across those five years, not an annual figure.
The Map Flips When You Count People
New York City records the crashes. Over the five years, its five boroughs together lost more than 1,100 people on the road, and Suffolk County on Long Island alone lost 703. Those are the big raw numbers, and they’re real.
They’re also spread across millions of residents. Once you divide by population, the ranking turns over. Here are the rural and upstate counties with the highest road-death rates, next to all five New York City boroughs.
| County | Region | Road deaths, 2019 to 2023 | Population | Deaths per 100,000 |
|---|---|---|---|---|
| Genesee | Upstate (Finger Lakes) | 51 | 57,902 | 88.1 |
| Sullivan | Upstate (Catskills) | 57 | 79,731 | 71.5 |
| Oswego | Upstate (Central NY) | 82 | 118,010 | 69.5 |
| Columbia | Upstate (Hudson Valley) | 43 | 61,977 | 69.4 |
| Cattaraugus | Upstate (Southern Tier) | 50 | 76,551 | 65.3 |
| Warren | Upstate (Adirondacks) | 40 | 65,734 | 60.9 |
| Bronx | New York City | 229 | 1,420,392 | 16.1 |
| Queens | New York City | 358 | 2,328,286 | 15.4 |
| Brooklyn | New York City | 347 | 2,634,268 | 13.2 |
| Manhattan | New York City | 182 | 1,576,787 | 11.5 |
| Staten Island | New York City | 54 | 494,039 | 10.9 |
The city has the crashes. Upstate has the roads that kill you.
Read the two blocks together and the story is plain. The safest borough for its residents, Staten Island at 10.9 per 100,000, and the most dangerous, the Bronx at 16.1, both sit far below every county in the top block.
Genesee’s rate is more than five times the Bronx’s. A person is dramatically more likely to die on the road in rural Genesee or Sullivan than anywhere in the five boroughs.
Raw Counts Hide It. Rates Reveal It.
Manhattan recorded 182 road deaths over the five years. Genesee recorded 51, less than a third as many. On a raw tally, Manhattan looks like the far more dangerous place.
Then you count the people. More than 1.5 million residents live in Manhattan. Fewer than 58,000 live in Genesee. Once each death is measured against the population exposed to it, Genesee’s roads turn out to be 7.6 times deadlier than Manhattan’s, per person.
This isn’t one strange county. Sullivan, Oswego, and Columbia all cleared 69 deaths per 100,000, and thirty counties, nearly all of them upstate, beat every borough. The pattern holds across the rural map: two-lane highways, higher speeds, longer drives to a trauma center, and fewer of the sidewalks and signals that slow city streets down.
A Small County, Checked Closely
Rural counties have small populations, and a small population means a single bad year can swing a rate. Genesee’s own numbers invite that question, so we tested it.
Genesee lost 14 people in 2019, then 10, 7, 11, and 9 in the years that followed. No single year carries the rate. When we split the window in half, the first stretch runs 7.5 times Manhattan’s rate and the second runs 7.9 times.
Drop any one year entirely and the gap still lands at 7 times Manhattan’s or more. The number is steady, not an artifact of one grim stretch of road in one grim year.
An honest note on who gets counted: these numbers include everyone who died on a county’s roads, whether they lived there or were passing through. The rate measures how deadly the roads are relative to the people who live around them, not any single driver’s odds.
The same is true in the city, where commuter traffic swells Manhattan’s count, and its rate still comes in second-lowest in the state.
One caution belongs on the table. These are five-year rates, not annual ones. Genesee’s 88 per 100,000 works out to about 18 deaths per 100,000 residents each year, and Manhattan’s 11.5 to about 2.
The gap between the two is the same either way. It’s the size of the toll that reads differently once you place it over five years instead of one.
What This Means for New Yorkers
Behind every number in that table are families, and New York law puts a clock on each of them.
A family can bring a wrongful-death claim under EPTL Section 5-4.1, generally within two years of the death. New York still limits those damages to economic losses, which means lost future earnings and funeral costs rather than the family’s grief. The legislature has tried to widen that more than once, and it hasn’t become law.
Rural crashes carry a second deadline that surprises people. When a road itself is part of the story, a blind curve, a missing guardrail, a worn-out shoulder, or a flooded low spot, the county, town, or state that maintains that road may share responsibility. Claims against a government run on a much shorter clock.
A General Municipal Law Section 50-e Notice of Claim is generally due within 90 days of the crash, and missing it can end a claim before anyone looks at the facts.
The county data also matters as evidence. When a fatal crash happens on a stretch of road the numbers already flag as dangerous, that record can help show a government knew about the risk. The pattern is public. Whether a specific road was on notice is the question a case turns on.
New York City has spent years driving its own street deaths down, and it shows. The statewide picture is a different story, and the rural one is harder still. The roads that kill New Yorkers at the highest rate aren’t downtown. They’re upstate, on the two-lane highways the rest of the state forgets.