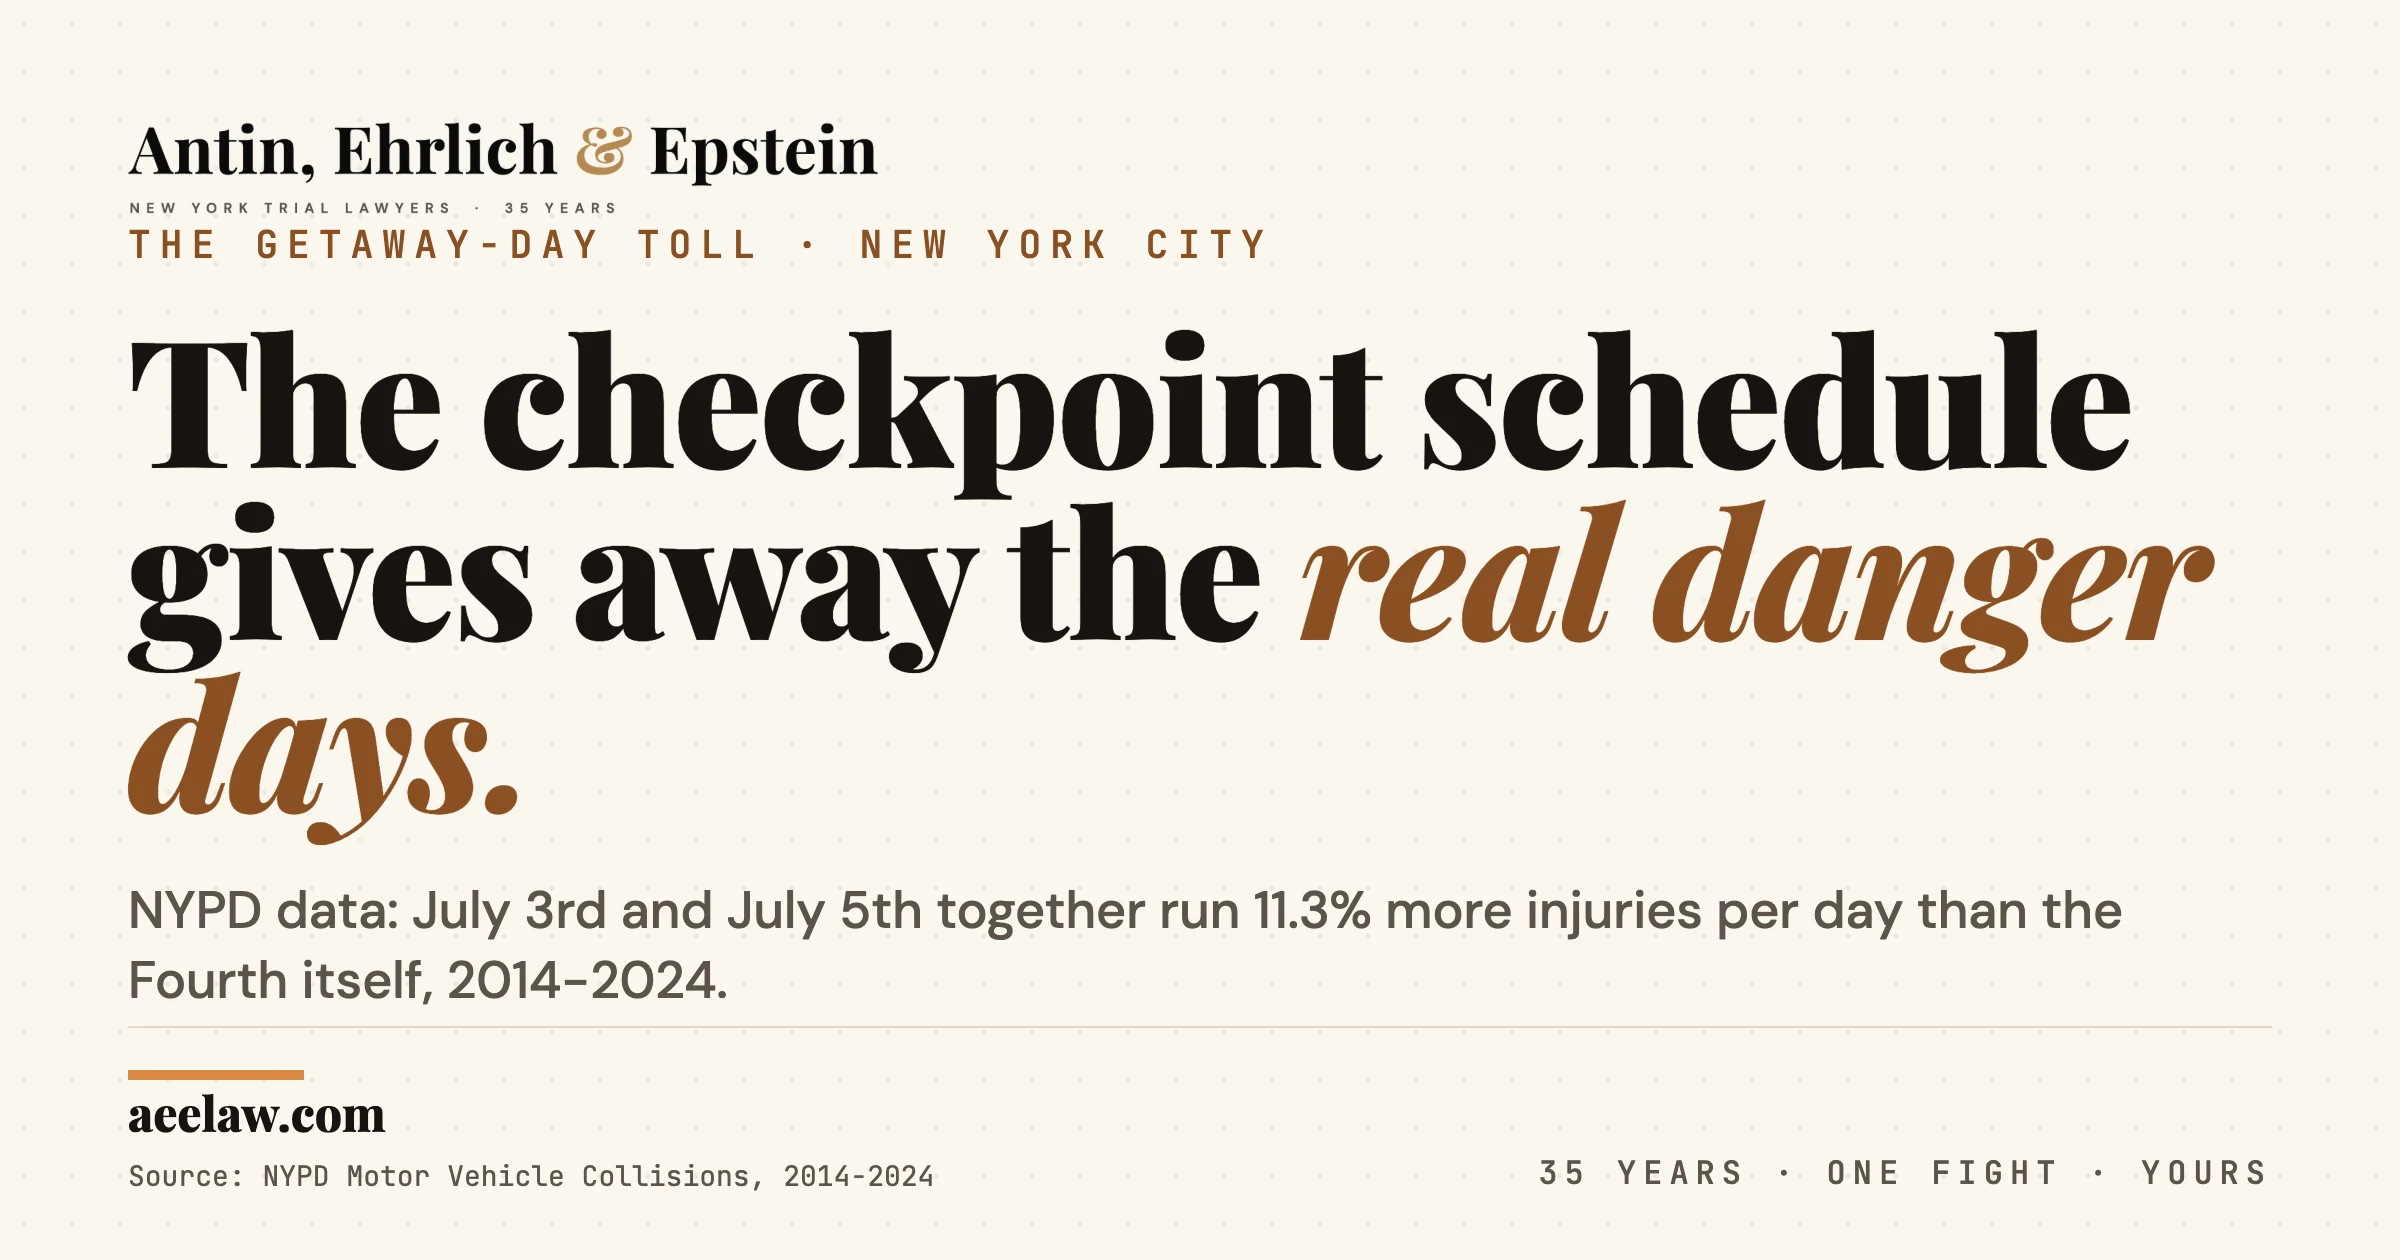
Everyone braces for July 4th. NYPD’s own data says that’s the wrong day to watch.
Eleven years of collision records tell the same story every year. July 4th runs quiet. The two days next to it don’t. July 3rd and July 5th combined average 166.8 people injured per day, 11.3% above every other day on the calendar. July 4th itself sits flat: 150.5 injured, almost exactly the citywide baseline of 149.8.
New York State’s own holiday-weekend crackdown backs this up, whether Albany means it as an admission or not. The enforcement window doesn’t open on the Fourth and close. It runs June 29 through July 5, covering the getaway and the return as hard as it covers the holiday itself. Read that schedule next to NYPD’s numbers and the rest of this data stops looking like a surprise.
Methodology
We pulled NYPD Motor Vehicle Collision records for the most recent eleven years with reliable reporting, 2014 through mid-2024. NYPD’s public feed drops off sharply after that point, a filing-lag artifact, not a real decline in crashes. That gave us 3,512 crashes tagged to ten July 4ths, 9,579 crashes tagged to twenty adjacent July 3rd and July 5th dates, and 1,760,952 crashes across every other day in the window.
National figures come from NHTSA’s Fatality Analysis Reporting System, 2000 through 2024, the federal record of every fatal crash in the country. NYC’s own July 4th sample is too small to compare fatalities day by day at reliable precision, so the NYC finding below is about injuries, not deaths.
The National Pattern Every New Yorker Has Heard
Nationally, July 4th is the most dangerous day on American roads. Federal crash data covering 25 years, 2000 through 2024, ranks July 4th first out of all 366 calendar days. The average is 138.96 deaths nationwide on July 4th alone, more than any other date on the calendar. Over that quarter century, 3,474 people died in 3,126 crashes on the Fourth.
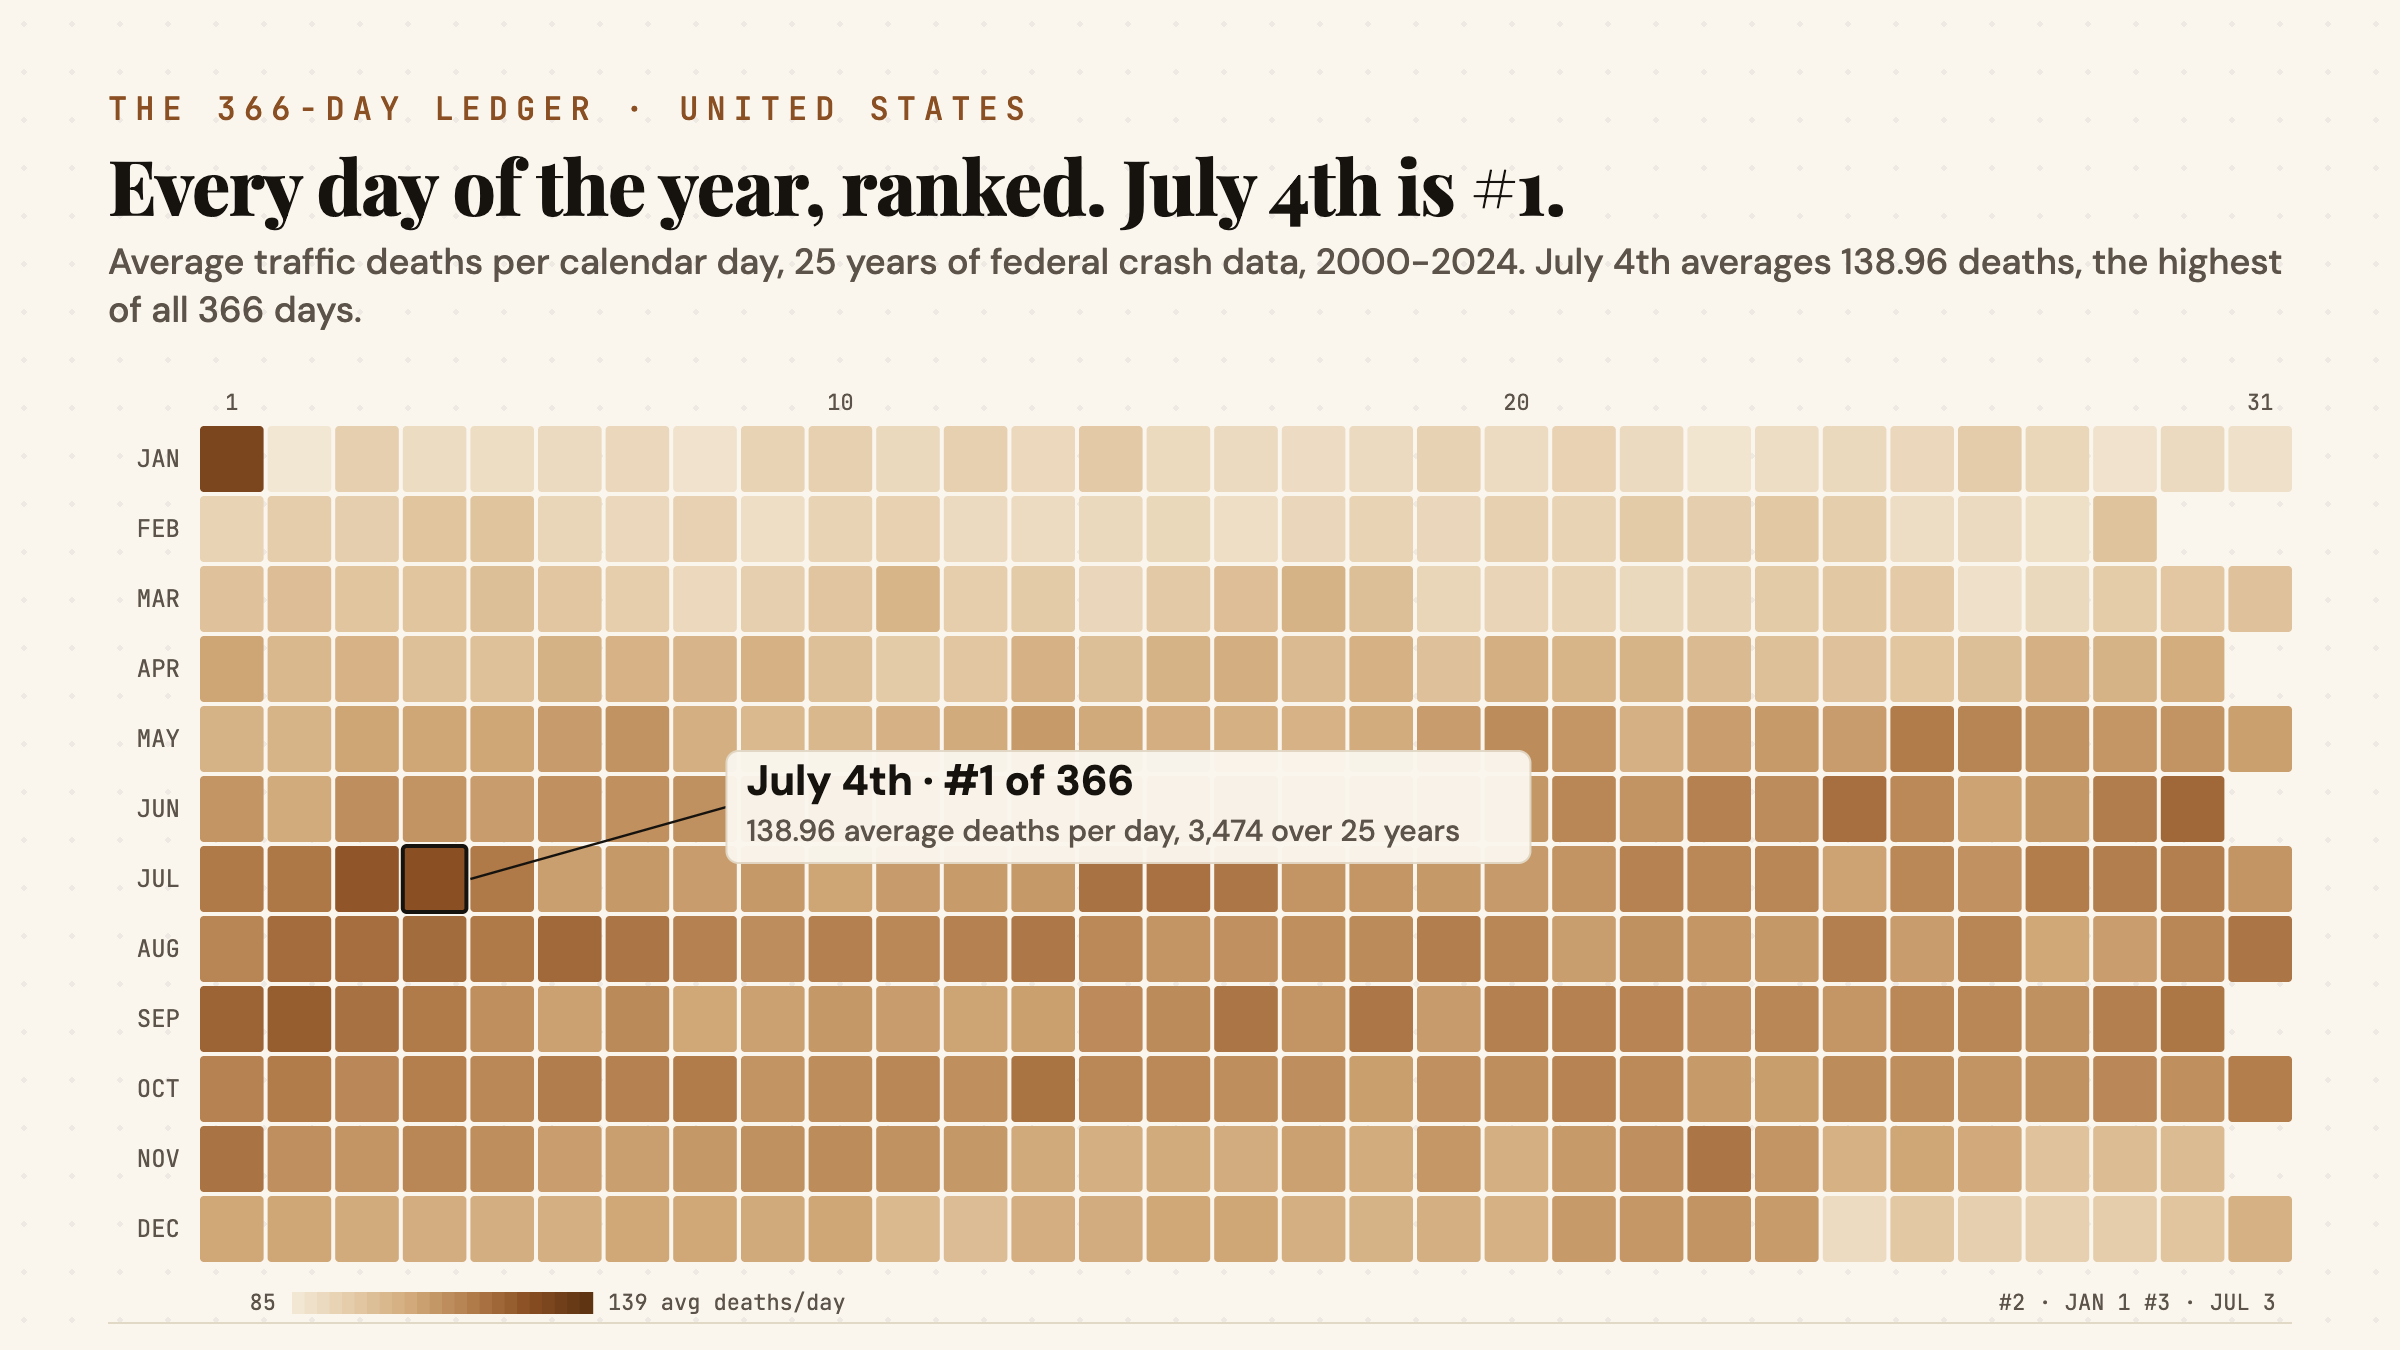
The pattern isn’t a one-year fluke. National data show it held in 25 of the last 25 years. Every single July 4th since 2000 recorded more deaths than that year’s own daily average. The worst on record came in 2003: 181 deaths, 54% above that year’s typical day.
That national record is real, and it’s why the assumption travels. But it doesn’t hold the same way inside the five boroughs.
Why New Yorkers Get the Timing Wrong
NYPD’s own collision data doesn’t just complicate the national myth here. It reverses it. Over 2014 through 2024, July 4th alone averages 150.5 people injured, statistically flat against the citywide baseline of 149.8 injured on an average day. The two days flanking it are where the real elevation sits. July 3rd and July 5th combined average 166.8 injured per day, 11.3% above baseline.
| Day | Injured per day | Vs. baseline |
|---|---|---|
| July 3rd and July 5th combined | 166.8 | +11.3% |
| July 4th itself | 150.5 | Flat |
| Every other day (baseline) | 149.8 | n/a |
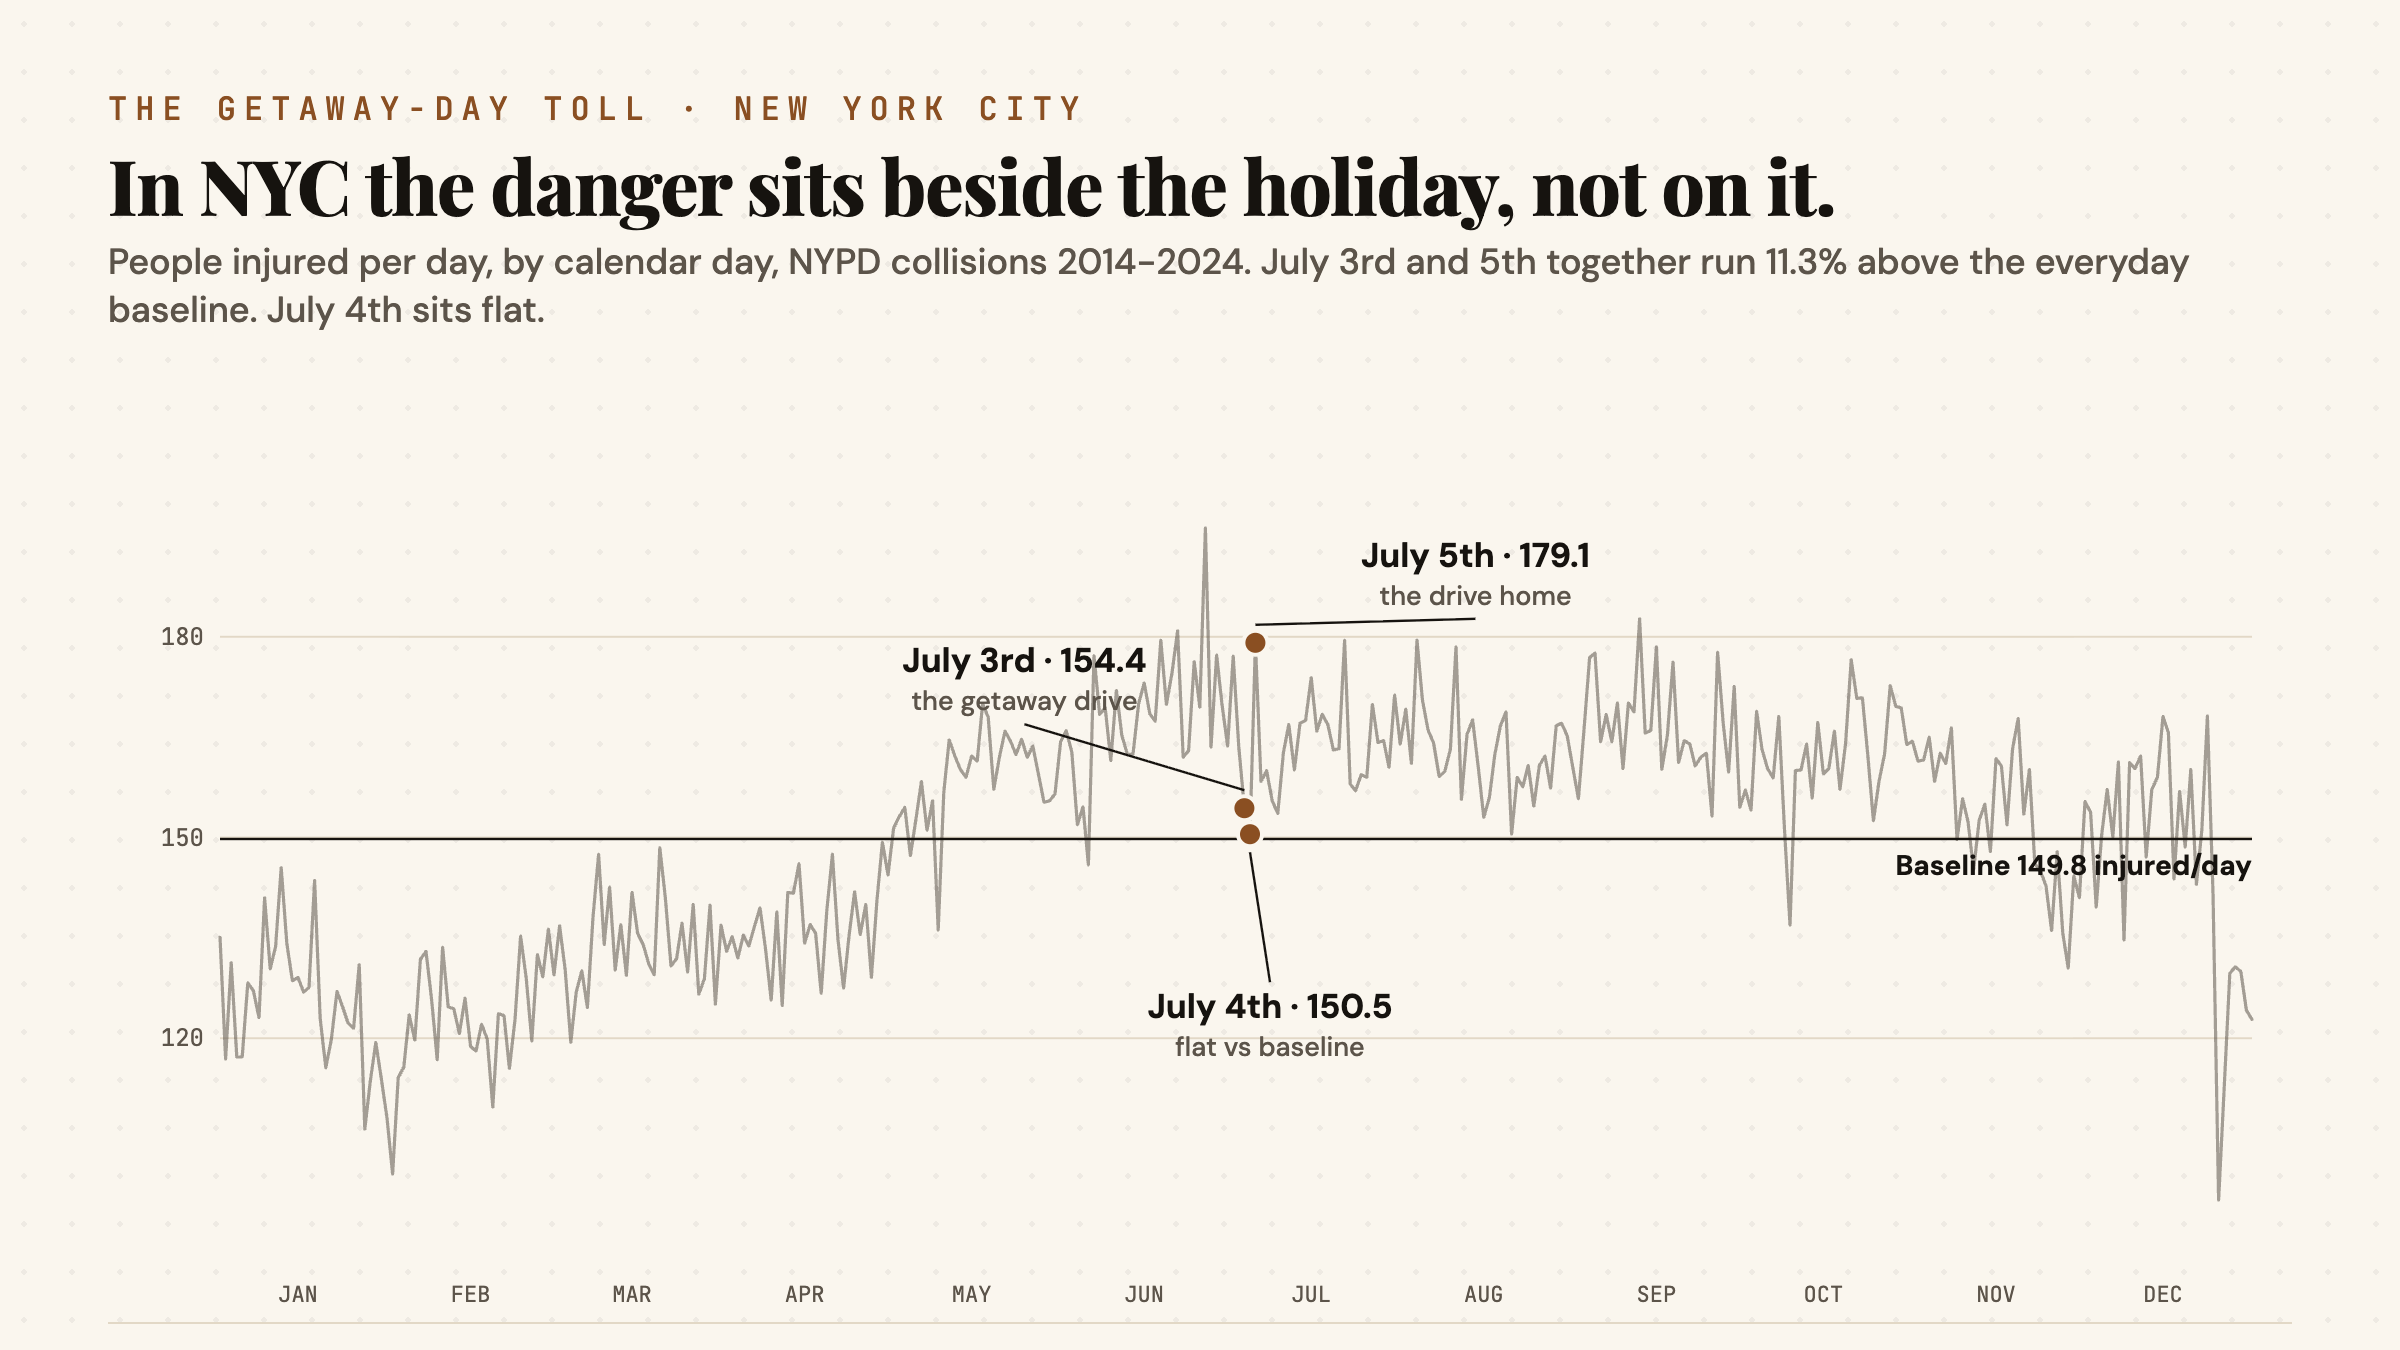
NYPD’s data doesn’t break out why. But the shape fits how the city actually moves over the holiday. A large share of July 4th itself is spent in one place, watching fireworks, gathered at a barbecue, not on the road. The getaway and return trips concentrate on the days around it instead.
The Hour to Actually Watch: 10pm
Even on July 4th itself, the danger isn’t the whole day. It’s about ninety minutes of it. NYPD data for 2014 through 2023 shows crashes spike hard at 10pm: 235 crashes across that hour over ten years, the equivalent of 23.5 crashes per July 4th. A typical night’s 10pm hour runs 15.5 crashes per day citywide. That’s a 52% jump, and 10pm is the single highest crash hour of the day on July 4th, ahead of 11pm and the early afternoon.
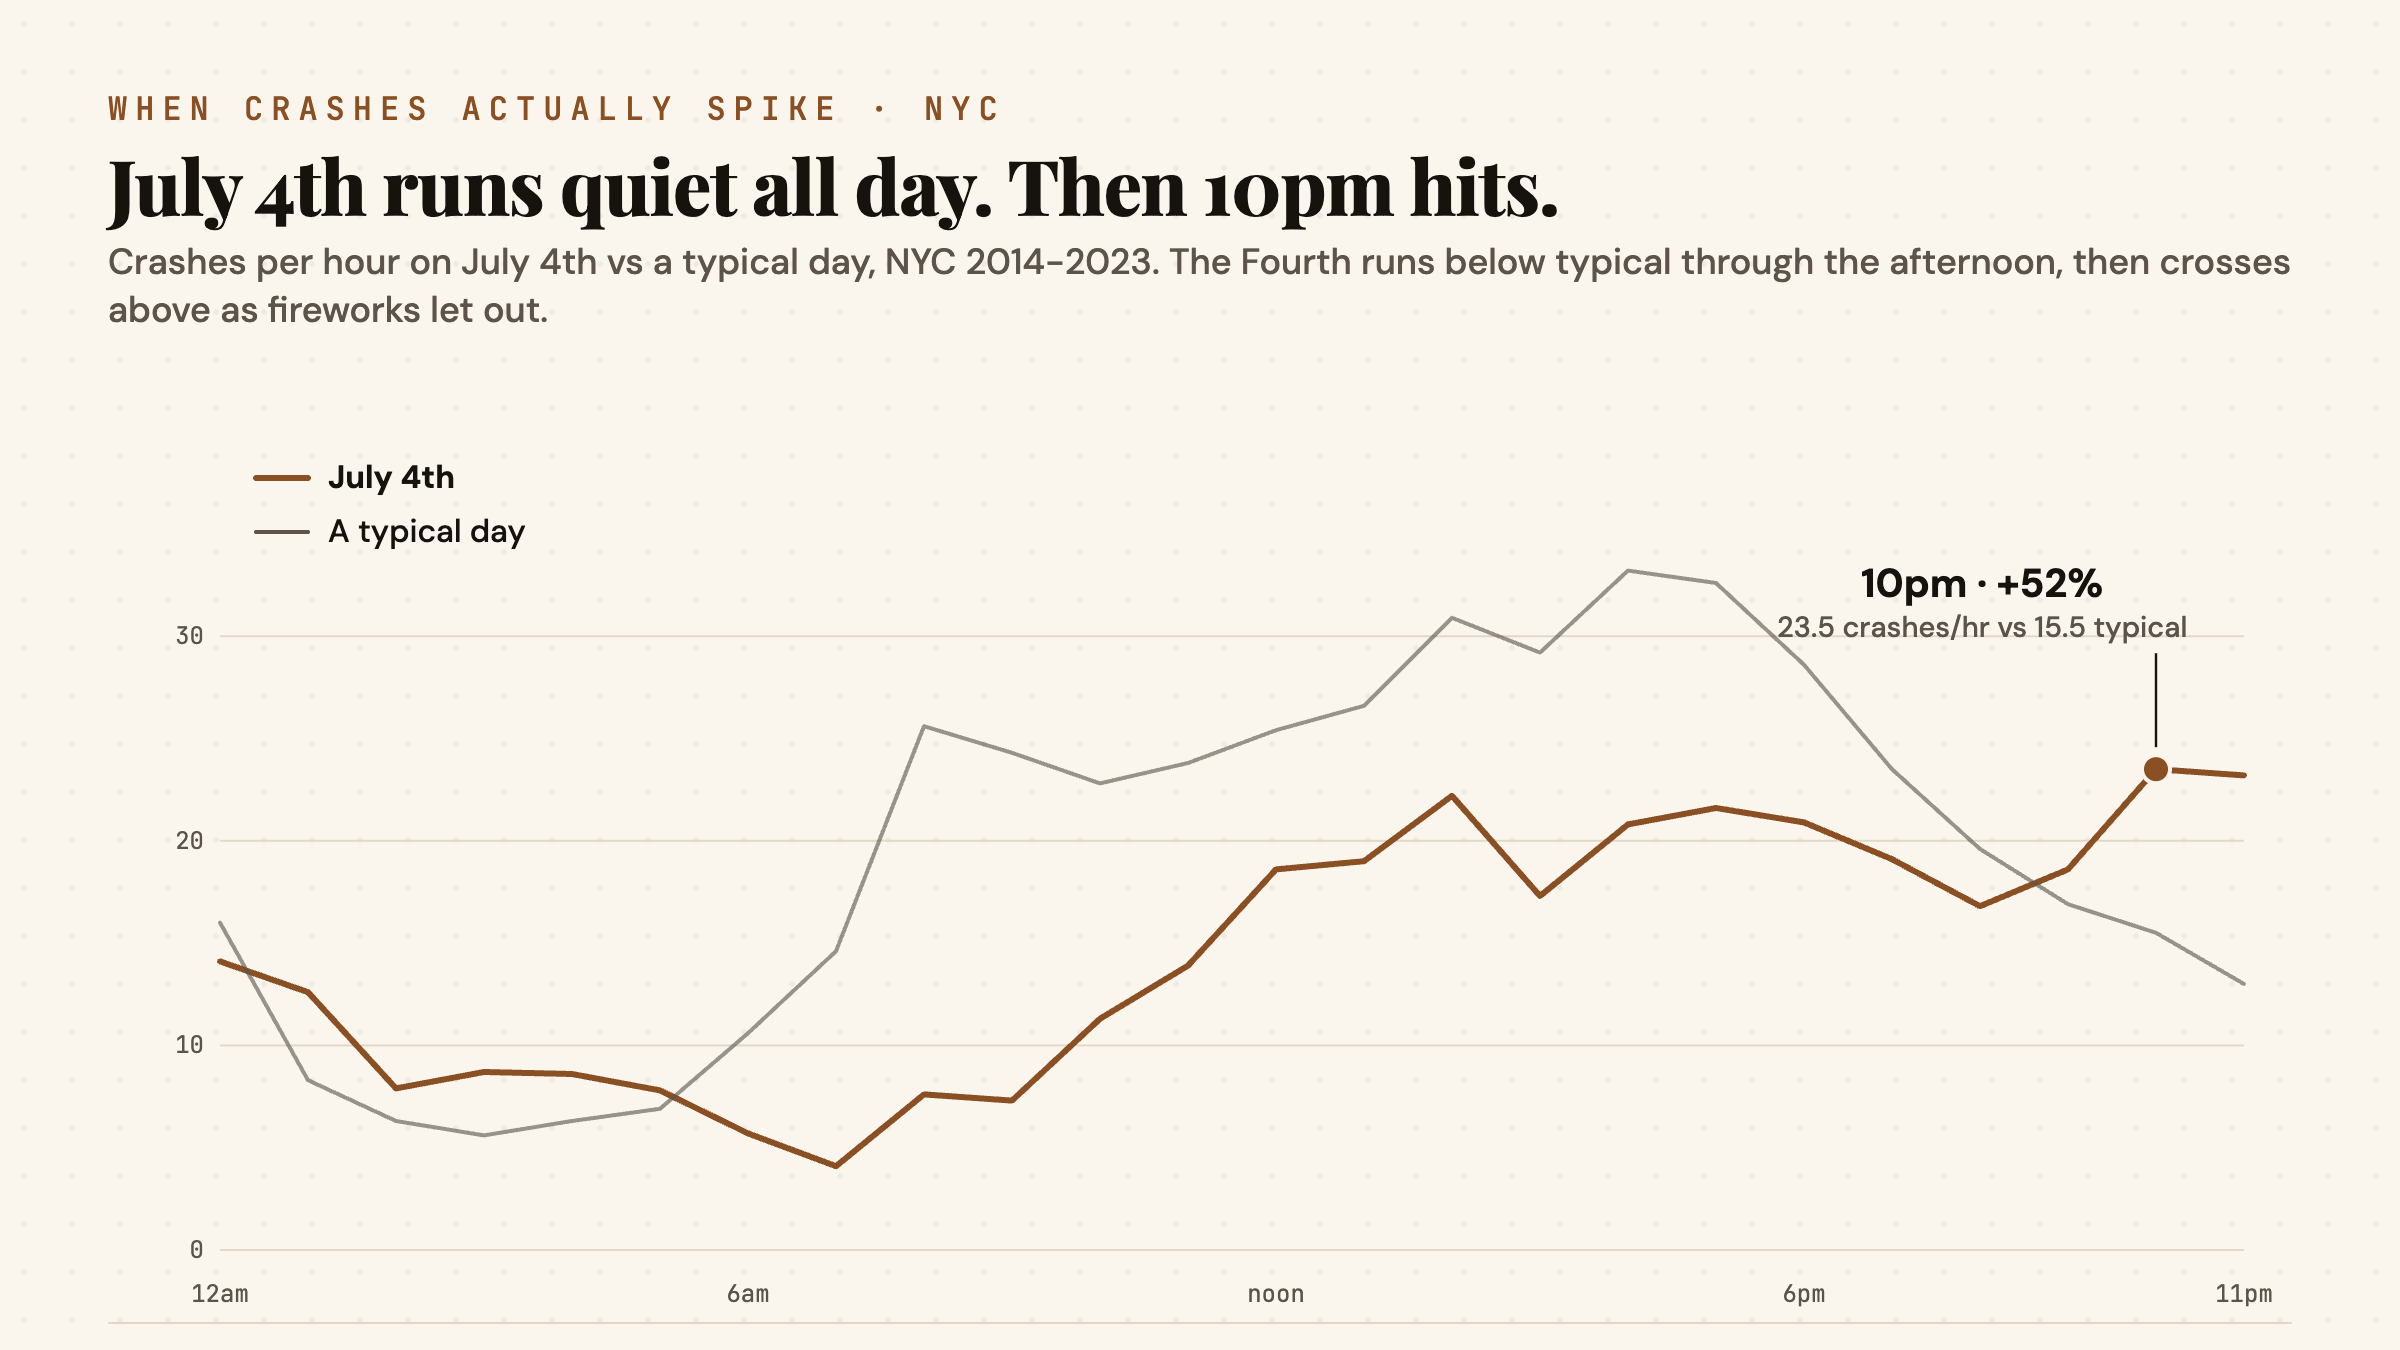
The timing lines up with how the night actually unfolds. Fireworks shows let out, crowds disperse into cars and rideshares at once, and a night that started with a lawn chair ends with everyone trying to leave the same few blocks at the same time.
Why the National Drunk-Driving Number Needs a Caveat
Federal data shows drinking drivers are involved in a disproportionate share of July 4th’s fatal crashes nationally. Over the cleanest reporting window, 2000 through 2020, 42.96% of July 4th fatal crashes involved a drinking driver, against a 31.6% baseline for an average day. FARS stopped reliably coding drinking-driver status in 2021, so we scoped this comparison to the 21 years where the data is complete rather than blend in four years that would understate the real gap.
That’s not a small difference. A New Yorker driving home from a July 4th gathering, or picking someone up after one, is sharing the road with drinking drivers at a meaningfully higher rate than on an ordinary night.
New York’s Own Deadliest Day Isn’t the Fourth Either
Zoom into New York State’s own 25-year record and a second pattern break shows up. Ranked against all 366 calendar days for average traffic deaths statewide, July 5th comes in at #9. July 4th ranks #80. Over 2000 through 2024, July 5th recorded 117 deaths against July 4th’s 98.
That gap is real in the 25-year record, but it’s thin. Nineteen deaths separate the two days across a quarter century, a margin worth naming honestly rather than dressing up as a wide split. What holds up without qualification: both July 4th and July 5th sit well above New York’s statewide daily average of 3.35 deaths.
What’s Different This Year
Two forces converge on this particular July 4th that don’t line up every year.
New York is marking the 50th Macy’s fireworks show alongside America’s 250th anniversary. The display launches from barges on both the Hudson and the East River near the Brooklyn Bridge, sending up 85,000 shells in 30 colors, with a new laser show off the bridge itself. The show kicks off at 8pm and the fireworks are expected to start at 9:25pm, which puts the crowd dispersing off both waterfronts right through the 10pm window the data already flags.
Albany’s impaired and reckless-driving crackdown runs June 29 through July 5, 2026, funded by the Governor’s Traffic Safety Committee. That window is the tell. A crackdown built only for July 4th would run one day. This one runs a full week, covering the getaway and the return as deliberately as it covers the holiday. Nobody at the Governor’s Traffic Safety Committee needed NYPD’s collision data to notice the pattern. The schedule already shows they did.
Last year’s version of the same campaign produced nearly 50,000 tickets statewide, more than 1,500 of them for impaired driving. Sobriety checkpoints and increased patrols are active on the exact days this data names, not just on the Fourth.
What This Means If You’re Driving This Weekend
The data points to a specific plan, not a vague caution. If your trip is flexible, the getaway and return days, July 3rd and July 5th, carry the higher measured injury rate in New York City. If you’re out on July 4th itself, the 10pm hour is where the risk concentrates, right as fireworks crowds clear out. Nationally and in New York, a drinking driver is more likely to be on the road across this whole stretch than on an ordinary weekend, which matters even if you haven’t had a drink yourself.
None of this changes what happens if you’re hurt anyway. New York is a no-fault state. A no-fault application must be filed within 30 days of a crash to cover medical bills and lost wages up to $50,000, regardless of who caused it. Recovering for pain and suffering requires meeting the “serious injury” threshold in Insurance Law § 5102(d). If a city agency or the MTA is involved, a Notice of Claim is due within 90 days under General Municipal Law § 50-e.
The holiday ends on the Fourth. The risk doesn’t. New York’s own enforcement calendar knew that before this data did.